SFP +100.06% (Directional Strategy Resonance)


The analysis of the SFP/USDT coin deal is a great example of how you can identify the inefficiency of sellers against the backdrop of large-scale sales and take advantage of the moment in time. The price holding with the dominance of market sales, the growth of BID orders and signs of local demand became a signal to enter a long position. And at the exit - a change in initiative and a decrease in purchasing power. A detailed analysis will show how to correctly read the volume and behavior of market participants in order to make confident trading decisions.
Table of content

Coin: SFP/USDT
Risk: medium
Understanding level: beginner
Reasons to enter
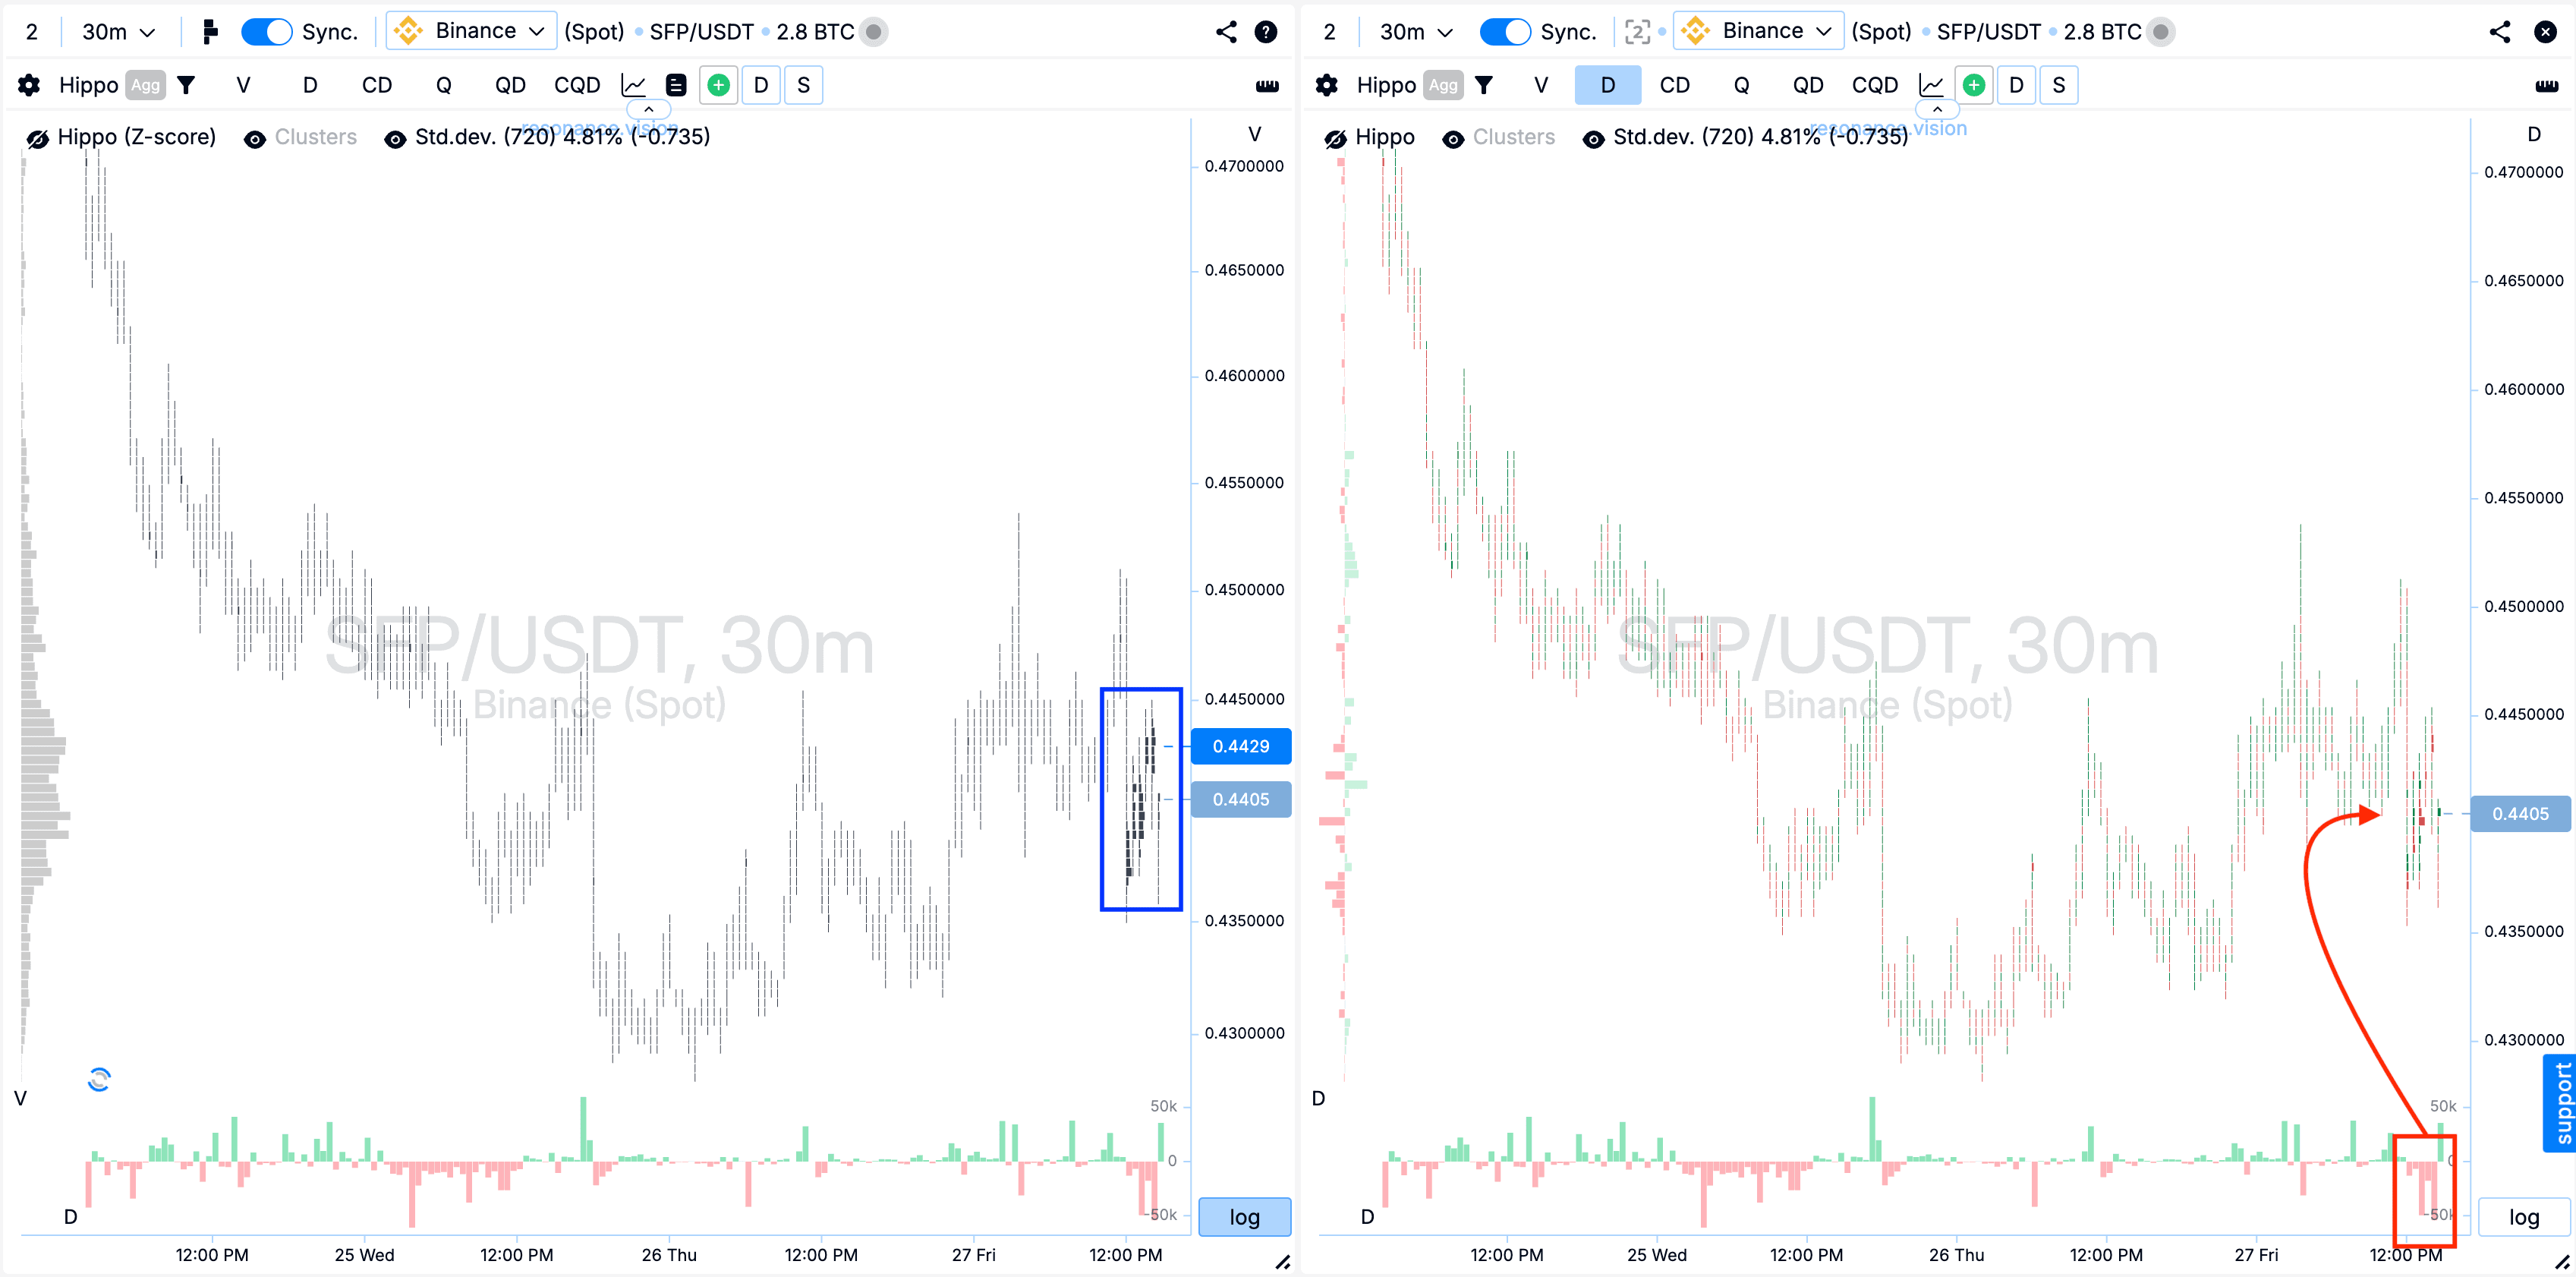
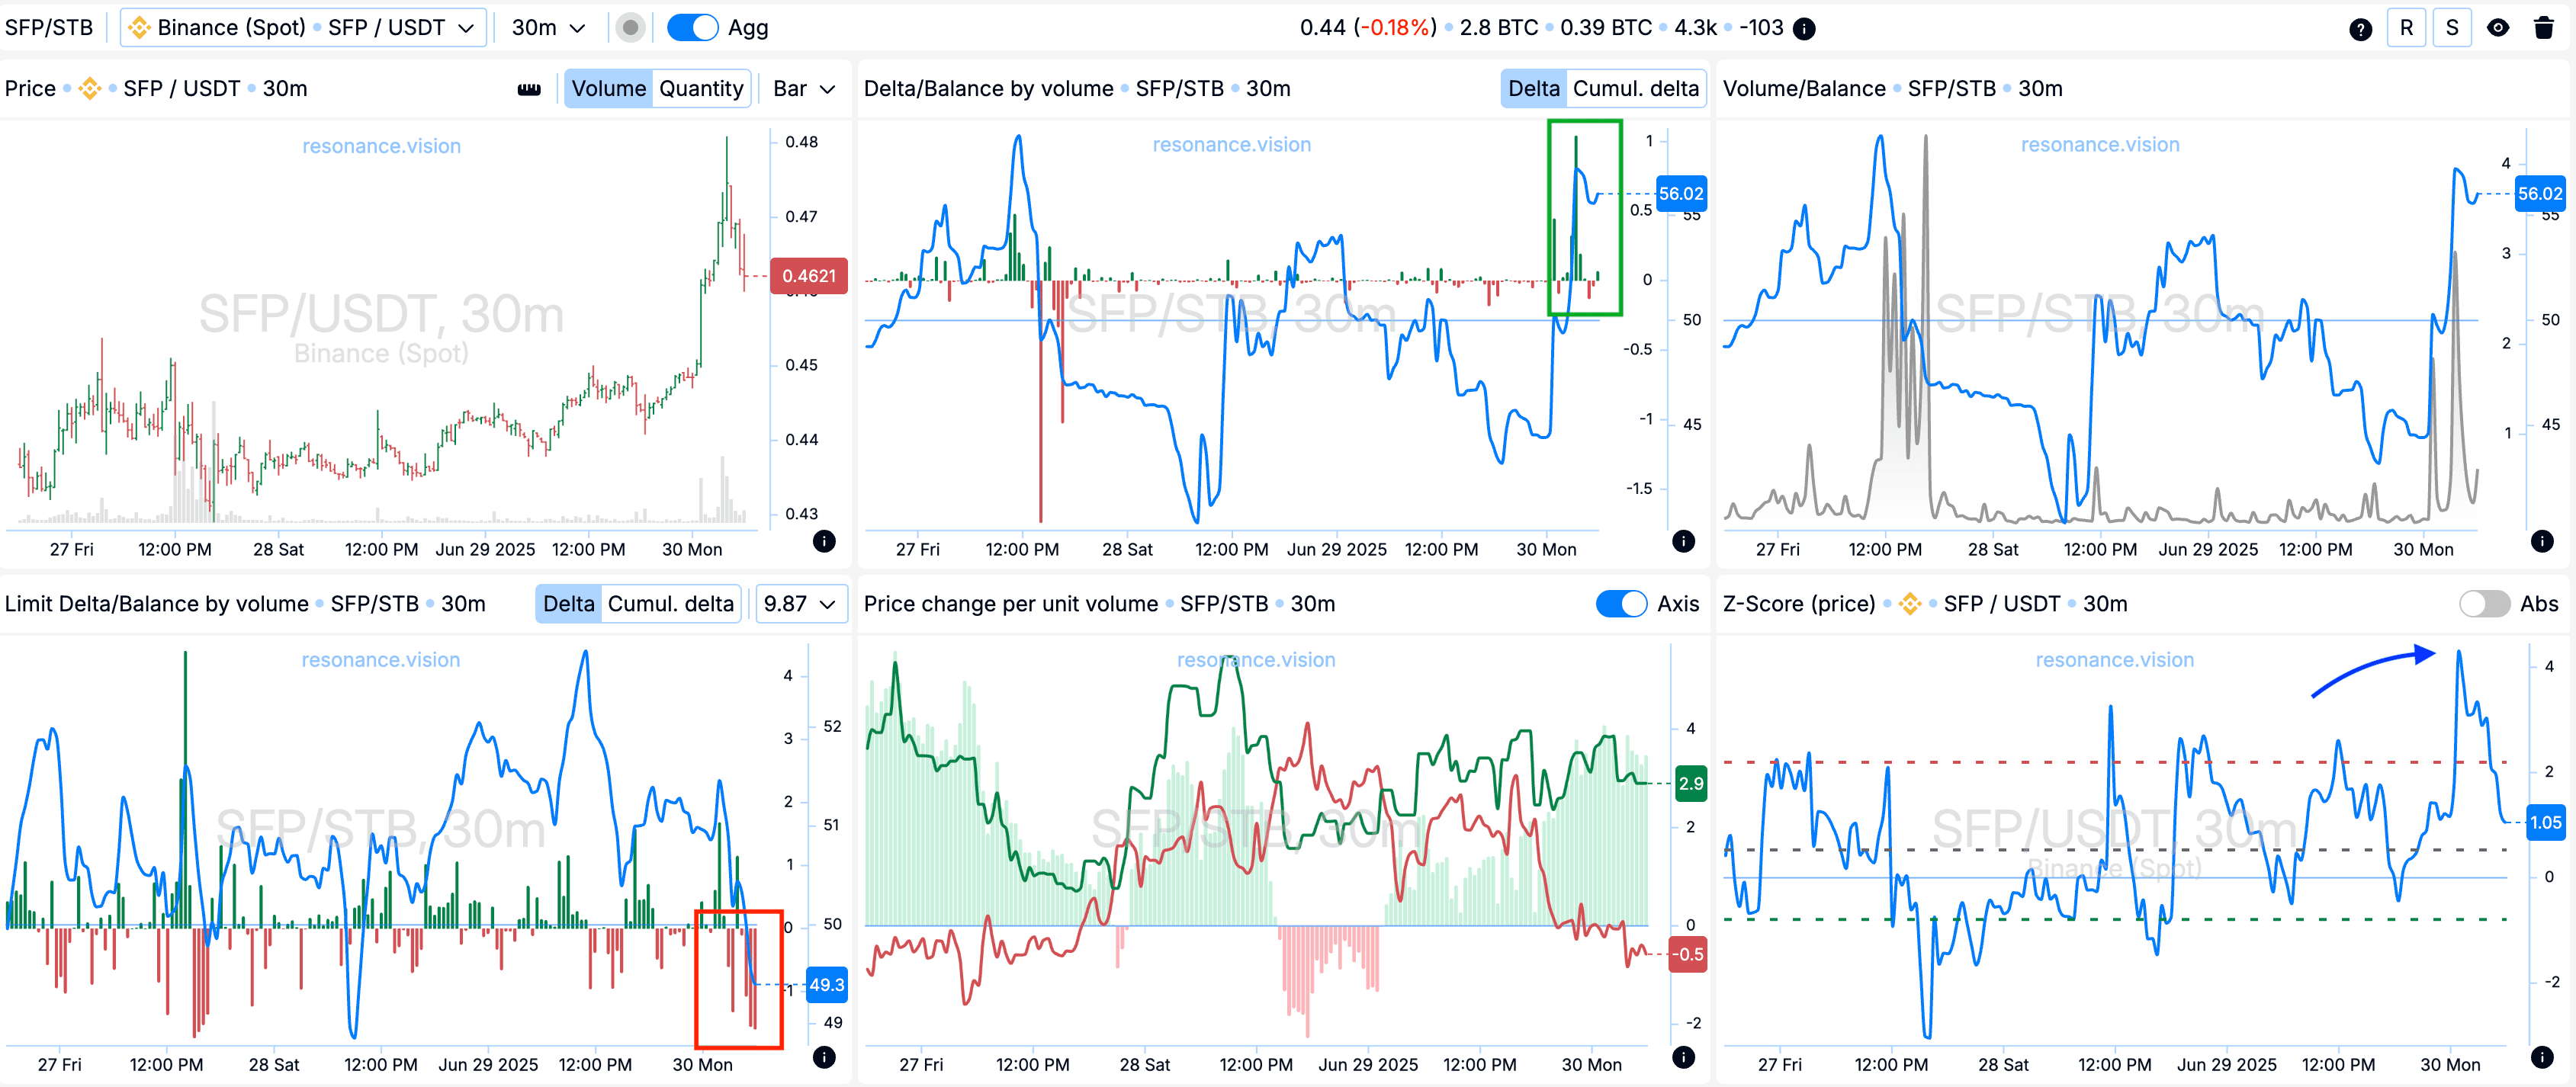
Cluster chart: I marked the price range in which clusters by volume were formed (blue rectangle). Within them, volumes for sale prevailed (red rectangle and arrow), but the price practically did not react to these sales - there was no significant decrease. This may indicate the inefficiency of sellers and the presence of local demand.
In Dashboard
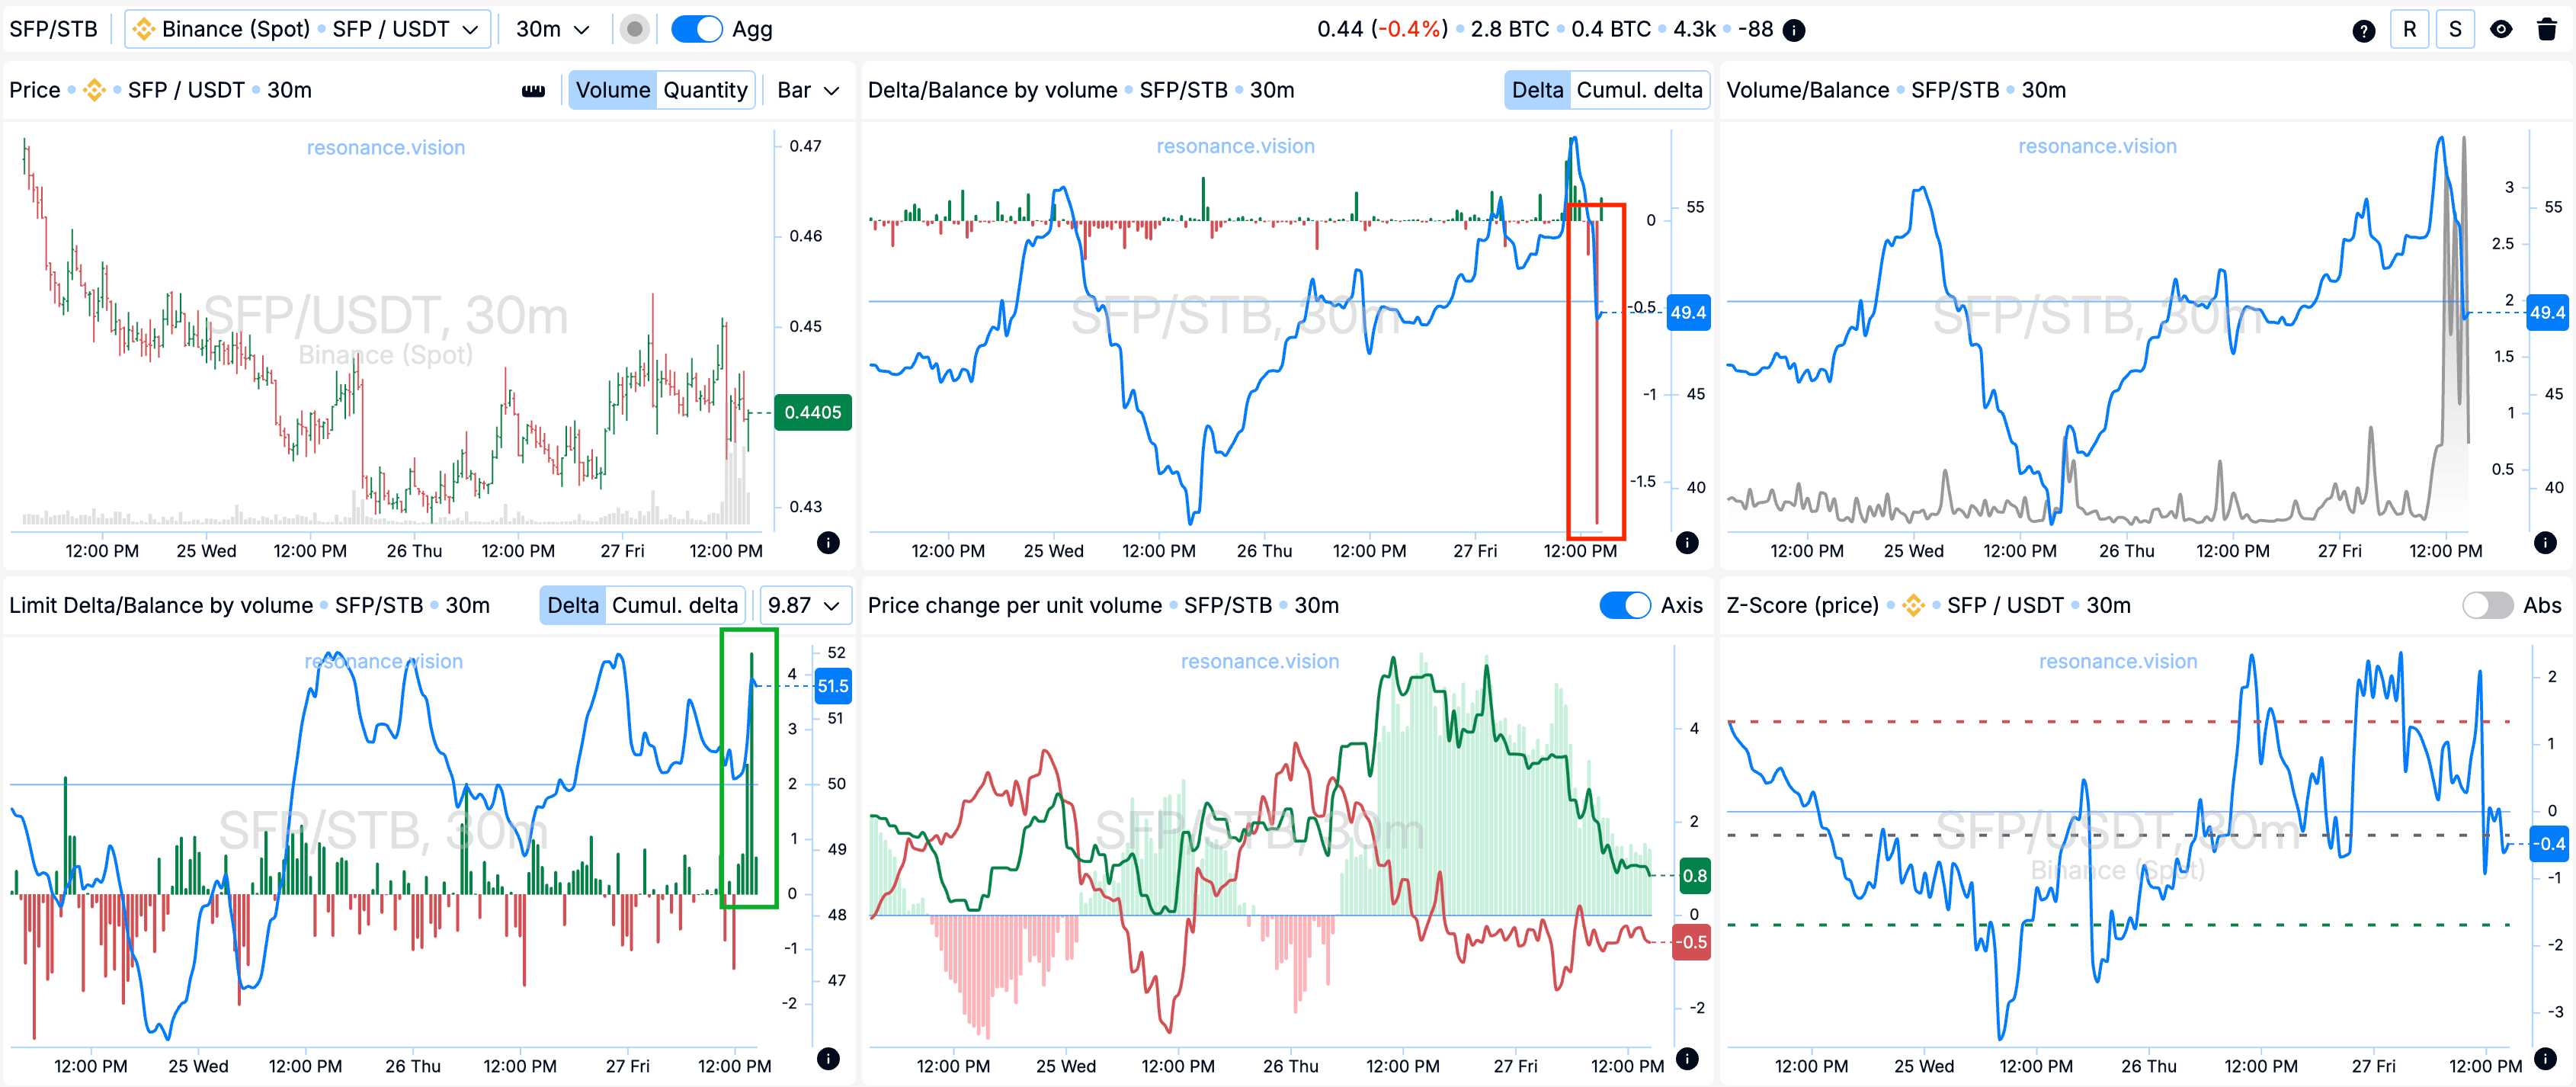
Delta/Balance by volume and limit delta: Aggregated data confirms the situation described above. In the visible range, the bar by market delta looks significant, and the balance is shifted towards sales (red rectangle). At the same time, there are surges in the limit delta: positive bars and a shift in balance towards buyers (green rectangle). Considering that the price is not falling against the background of prevailing market sales, a hypothesis arises for entering a long - limit purchase orders, apparently, successfully withstand the pressure from sellers.
In the BAS chart
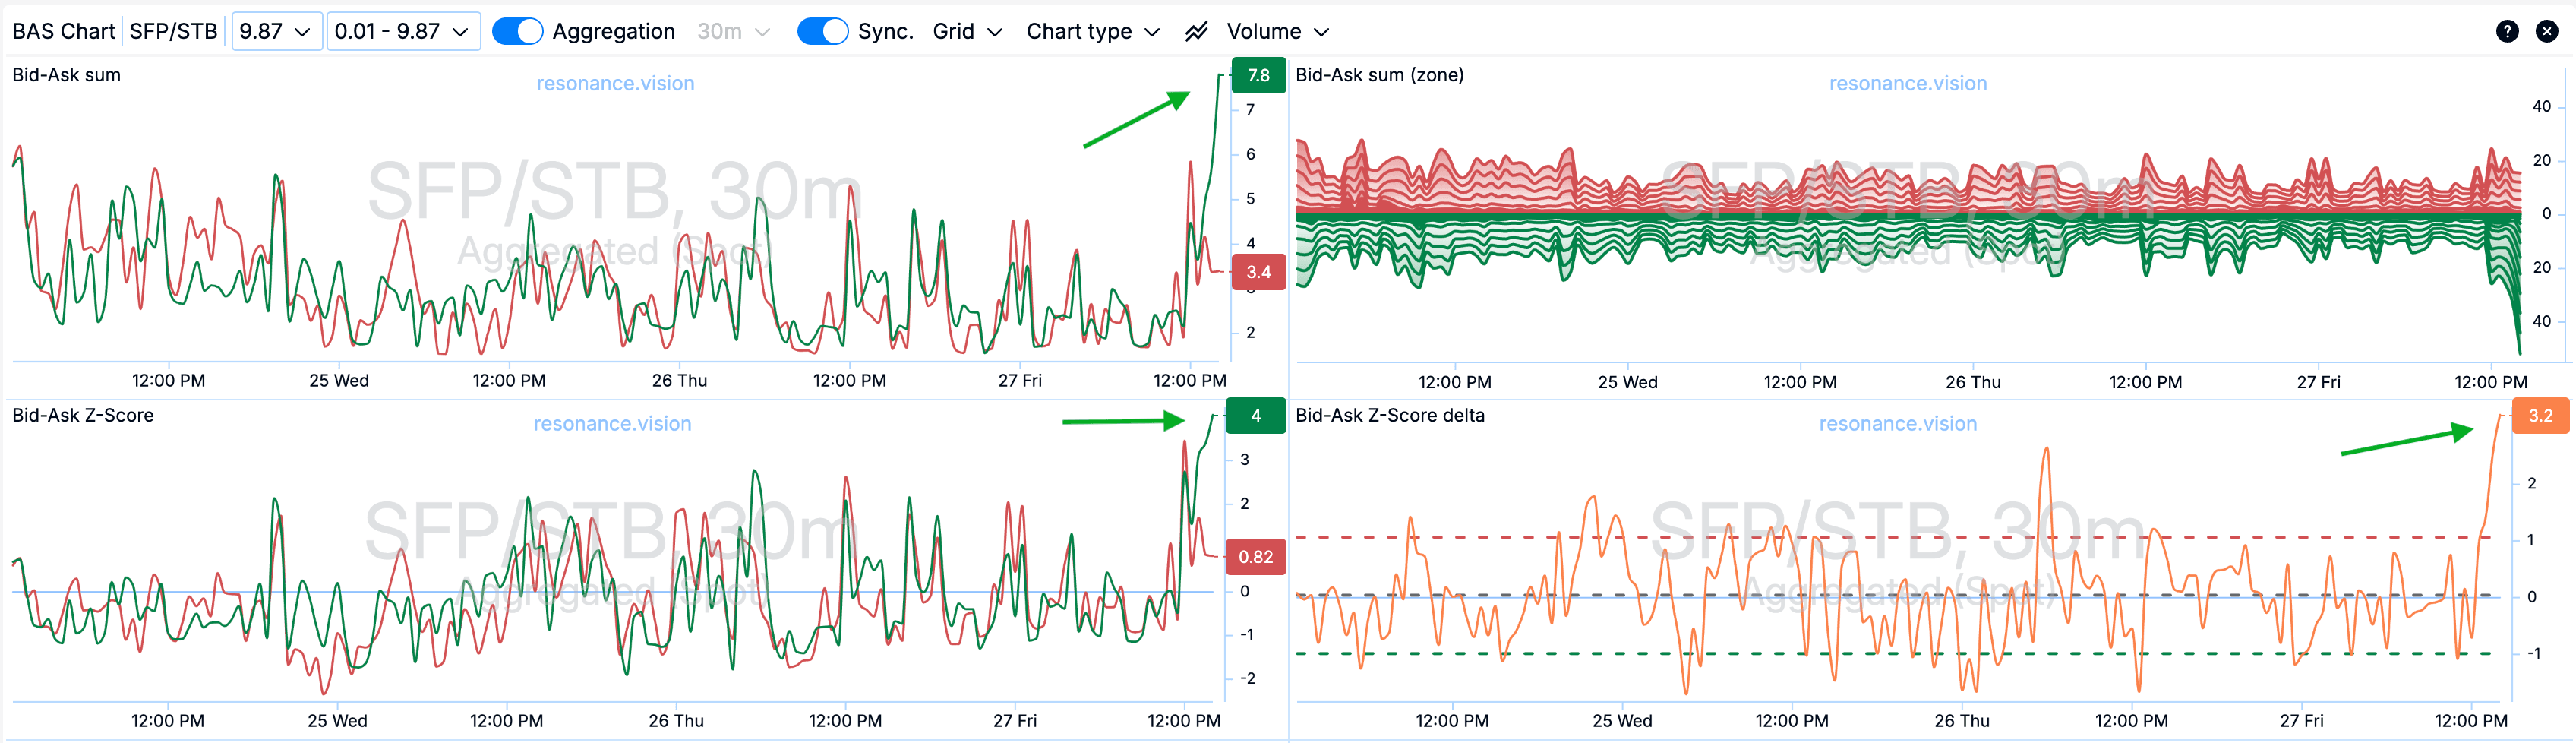
Bid-Ask Z-Score and Bid-Ask Sum: At this point, it is clear that the activity of BID orders began to increase noticeably - this is marked by arrows. Such an increase may indicate an increase in interest from buyers and support in this price range.
Exit reasons
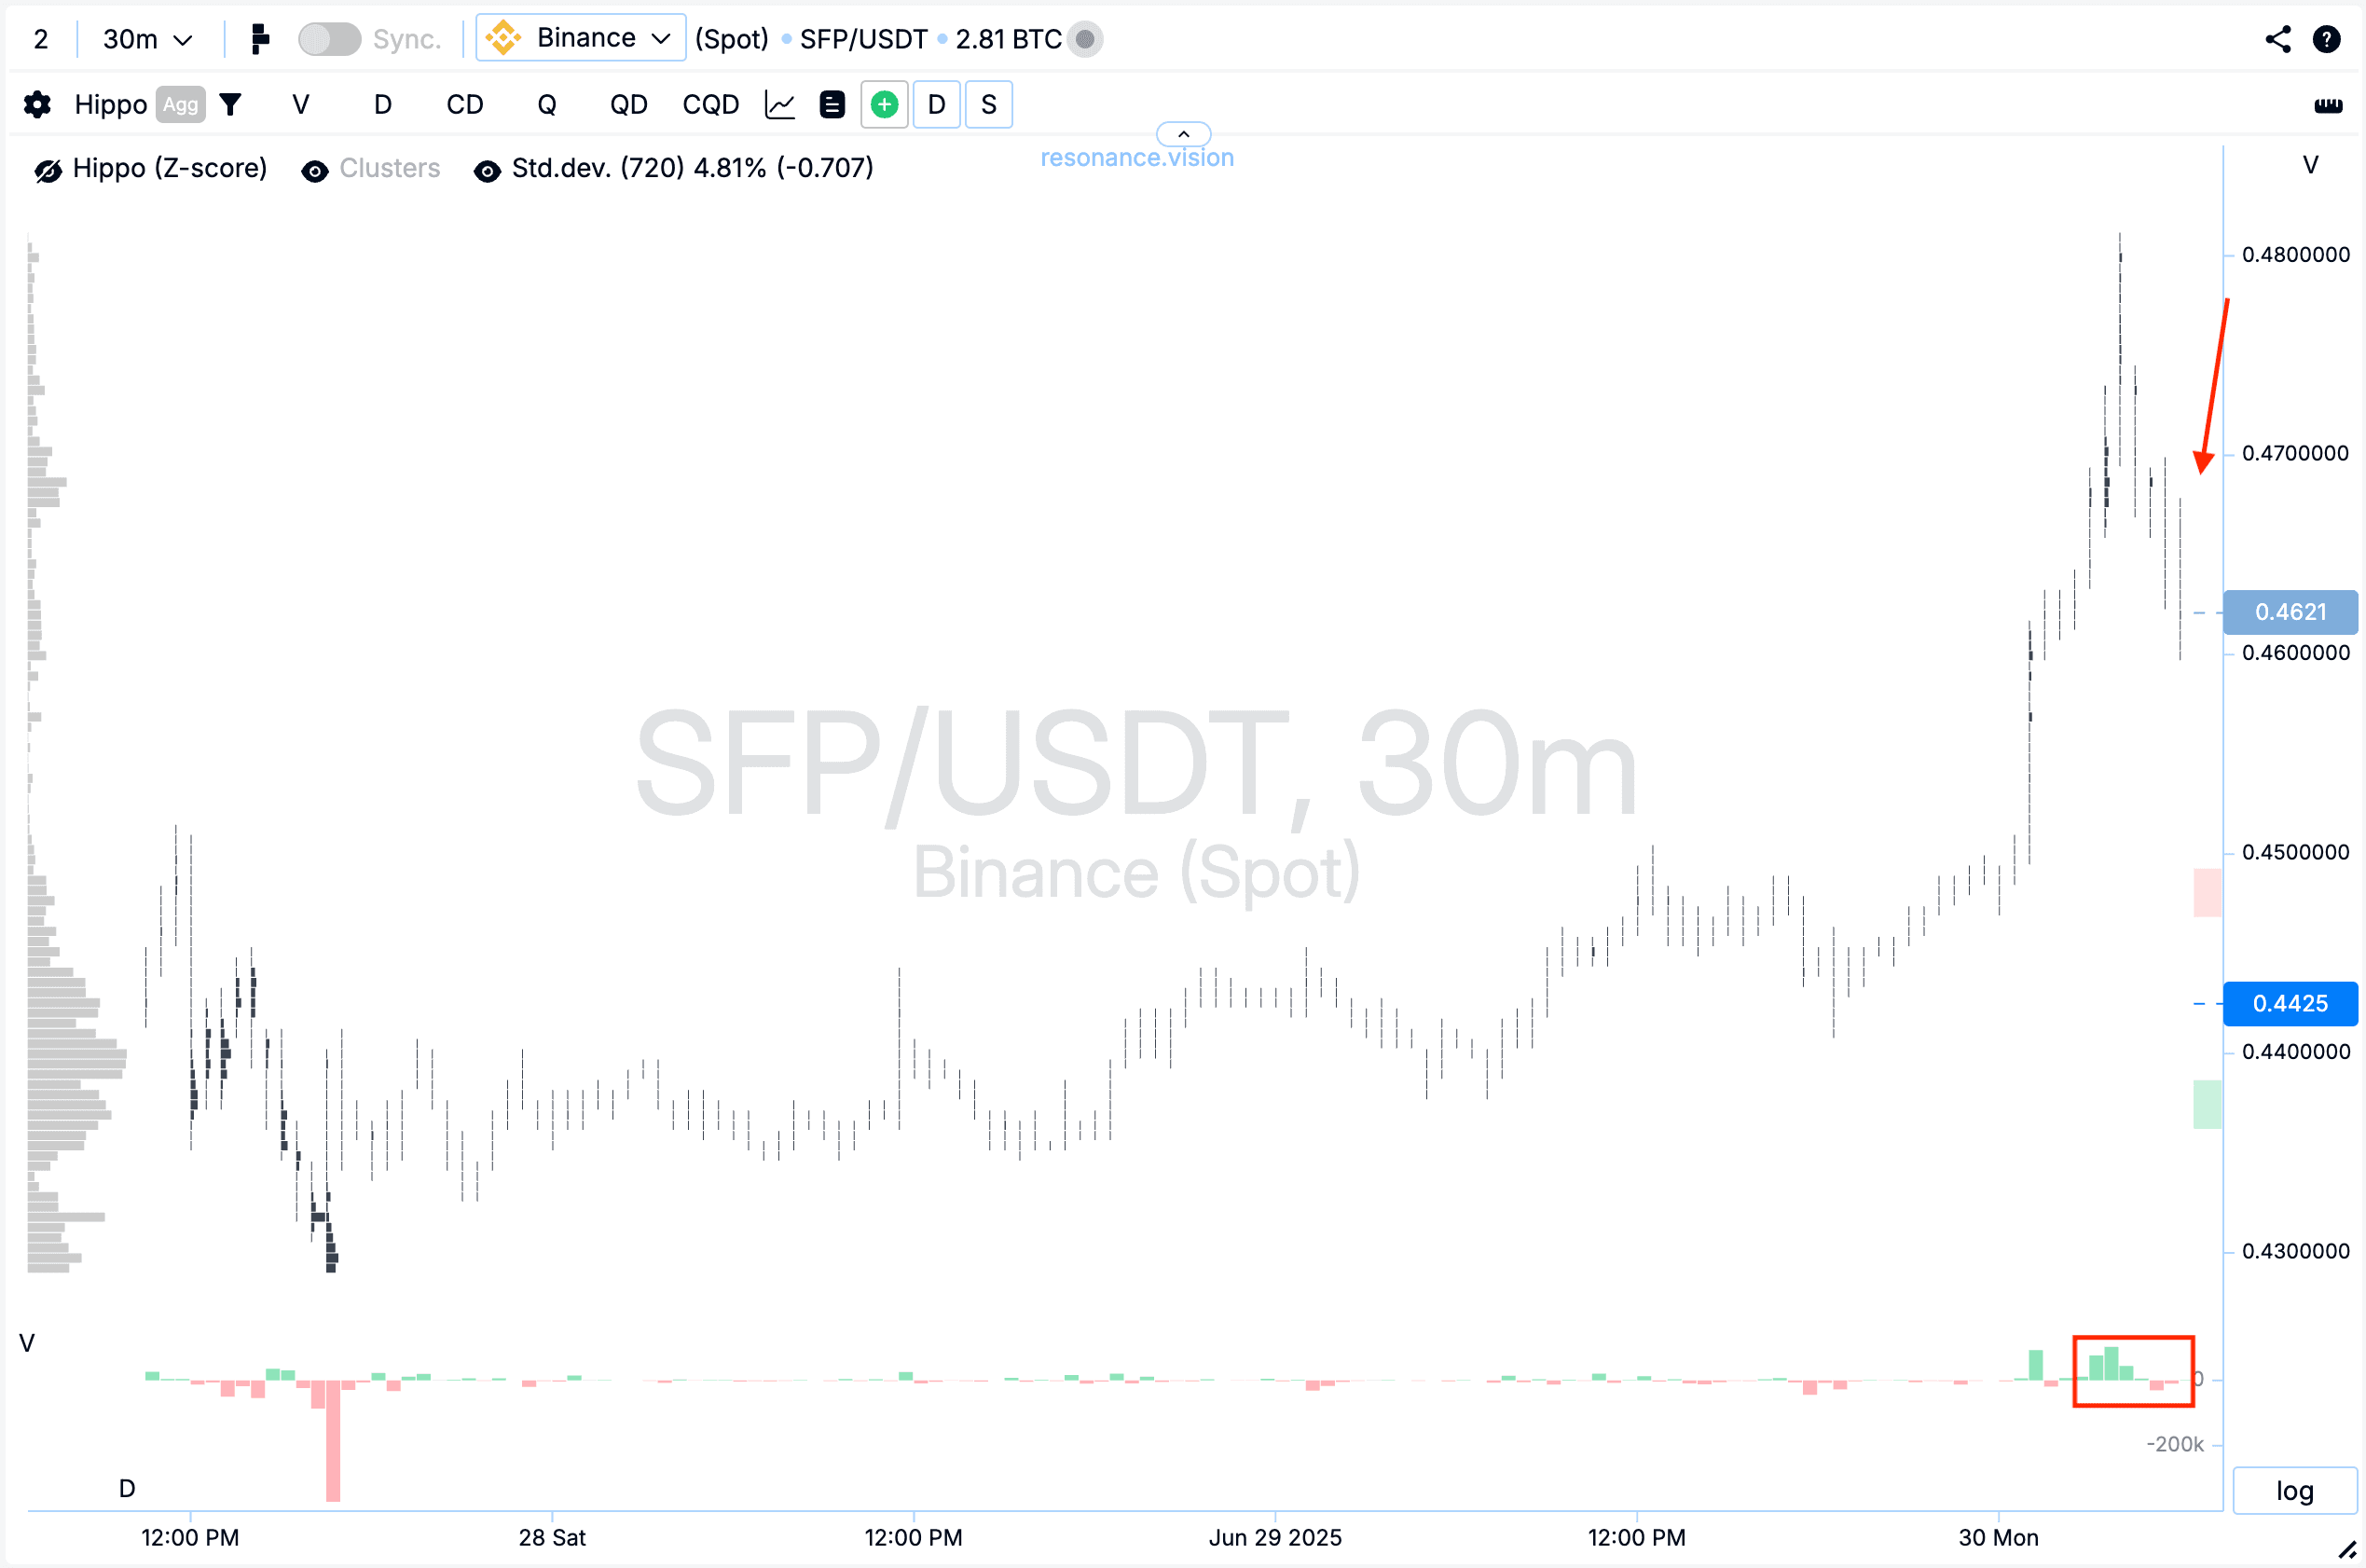
Cluster chart: After the repeated impulse, the volumes of purchases began to gradually decrease and were replaced by prevailing market sales. This was accompanied by a corresponding price reaction - it began to decline (marked with a red rectangle and arrow).
In the Dashboard
Delta/Balance by volume and limit delta: The situation has changed compared to the entry point - market purchases ceased to affect the price, while limit orders began to actively absorb them. This is clearly visible on the charts - marked with green and red rectangles.
Z-Score (price): At the peak of the local movement, the price reached abnormal values — the deviation exceeded 4 standard deviations (blue arrow), after which a reversal and subsequent decline began.
Result
We managed to secure a profit of +100.06%.

Conclusion
The SFP coin deal became an example of how important it is to take into account not only the current market activity, but also the strength of limit orders. Despite the dominance of sales, the price held steady, which signaled the presence of local demand and provided a strong argument in favor of the long scenario.
At the exit, the picture changed: buyers lost their advantage, volumes began to decline, and the market began to show signs of weakening. It was important not to miss the moment and fix the result before the reversal.
This case emphasizes the importance of monitoring the dynamics of market and limit orders, as well as timely response to changes in the behavior of market participants.
Follow new articles in our telegram channel.
No need to invent complex schemes and look for the "grail". Use the Resonance platform tools.
Register via the link — get a bonus and start earning:
OKX | BingX.
Promo code TOPBLOG gives you a 10% discount on any Resonance tariff plan.


