KAIA +21.29% (Resonance Directional Strategy)

A breakdown of the KAIA trade using the cluster chart, dashboard, and Resonance platform tools. We show how supply absorption, local deficit, and rising buyer efficiency help identify a long entry point.
Table of contents

There are often situations in the market where selling dominates, but price stops reacting with further downside. If selling no longer leads to new lows, it means a limit buyer is becoming more active, absorbing supply and forming a local deficit.
That is exactly the situation that developed in the KAIA trade. The trend was gradually shifting from bearish to bullish. The cluster chart showed that seller pressure was weakening, while the buyer was beginning to take over the initiative. Additional confirmation came from the aggregated metrics: the efficiency of market buying started to exceed the efficiency of selling.
The idea was found using the Resonance Screener.
Entry reasons
Cluster chart
The downtrend gradually started to shift into an uptrend (green arrow). Selling stopped leading to new lows (green rectangles). This pointed to the willingness of a limit buyer to absorb opposing volume and increased the probability of further upside.
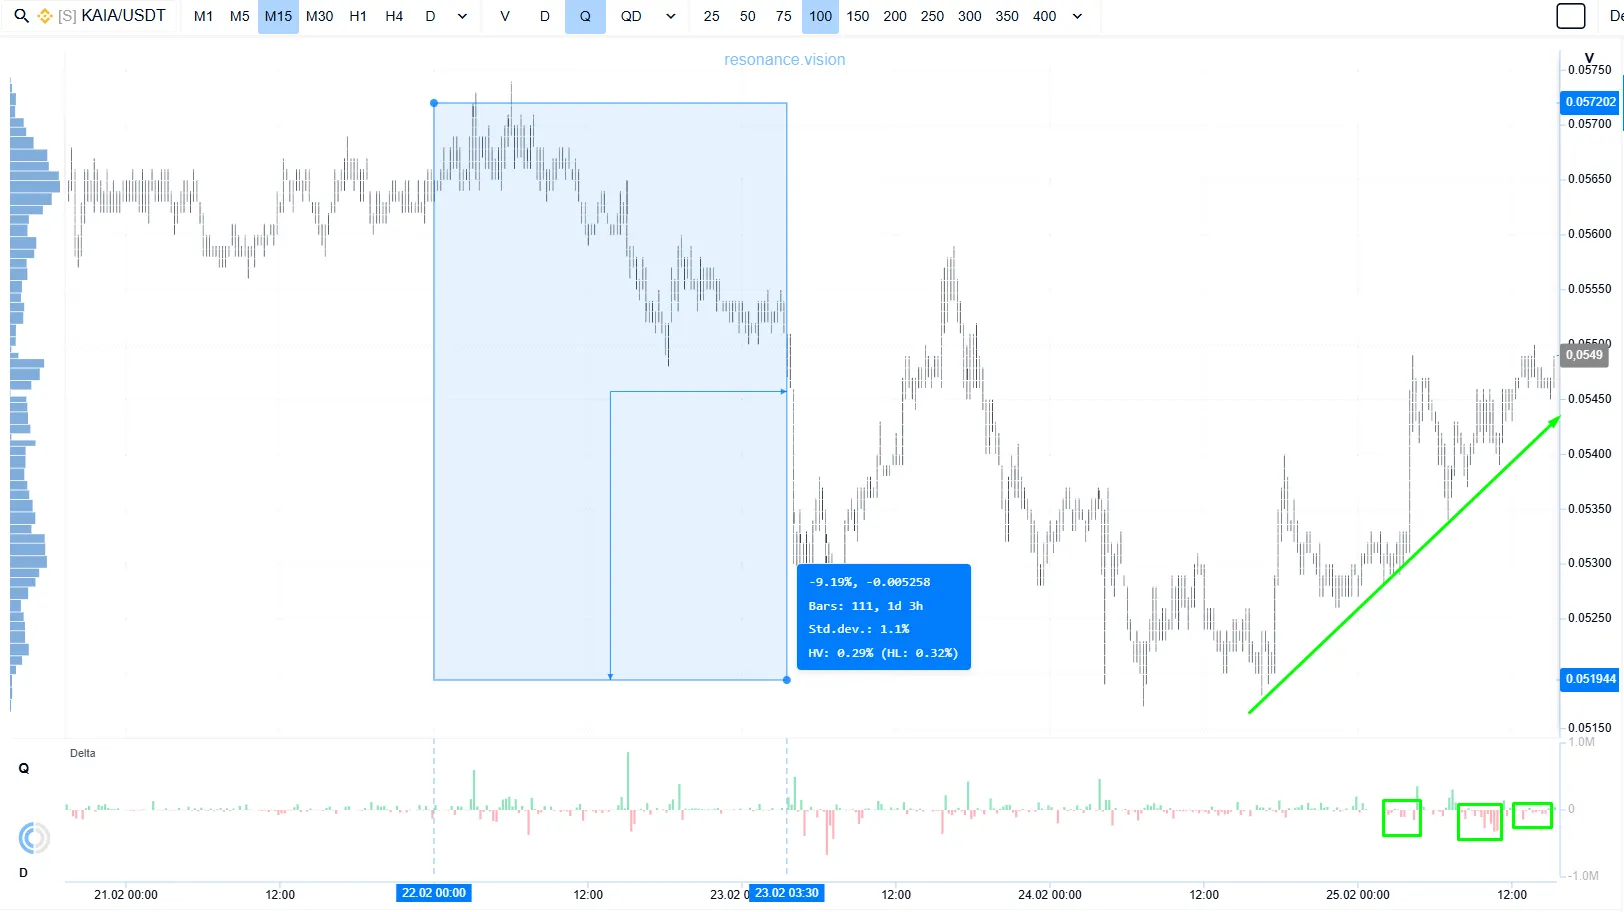
The entry was executed with a stop-loss below the local low. The trade risk was 2%.
Dashboard: aggregated metrics
Delta / Volume Balance
Across all pairs, supply was being absorbed by a limit buyer (green arrow), while price kept moving higher. This type of activity pointed to the realization of a previously formed deficit.
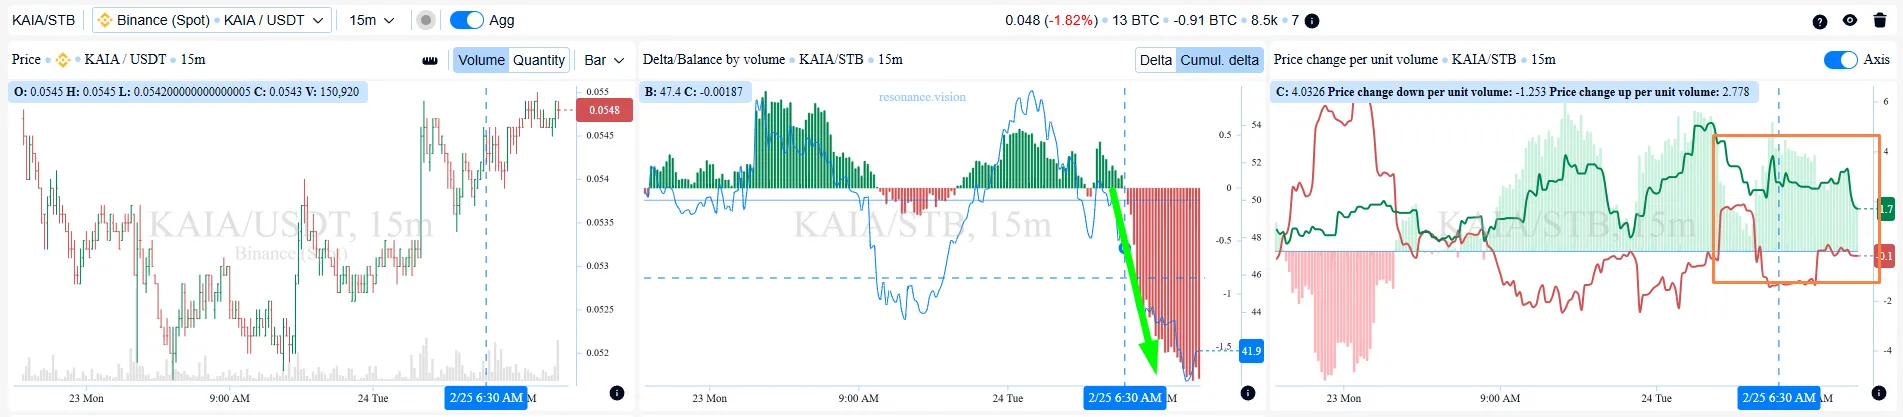
Price change per unit of volume
The efficiency of market orders diverged in favor of buyers (orange rectangle). Market buys started to have a stronger effect than market sells. This increased the probability of continued upside movement.
Exit reasons
Cluster chart
Despite continued large market buying (green arrows), price stopped making new local highs (red line). The buyer ran into strong limit resistance.
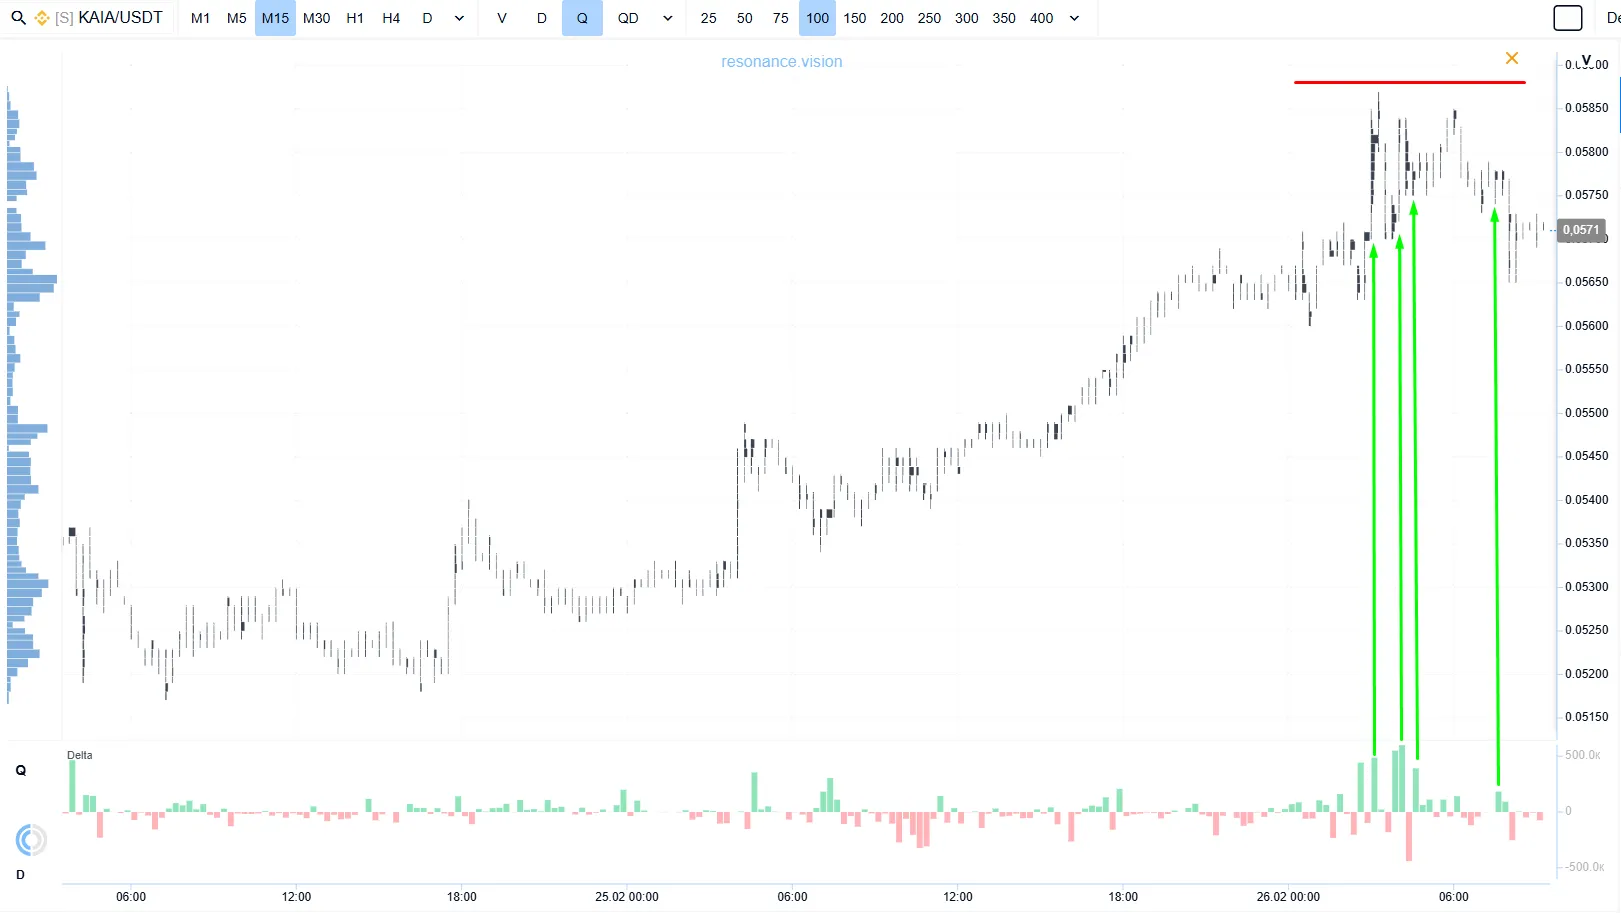
This situation indicated that the coin had moved into a consolidation phase — surplus. In this phase, the efficiency of market buying starts to decline, while the asset’s upward move begins to slow down. The appearance of these signs became the reason to lock in the position.
Conclusion
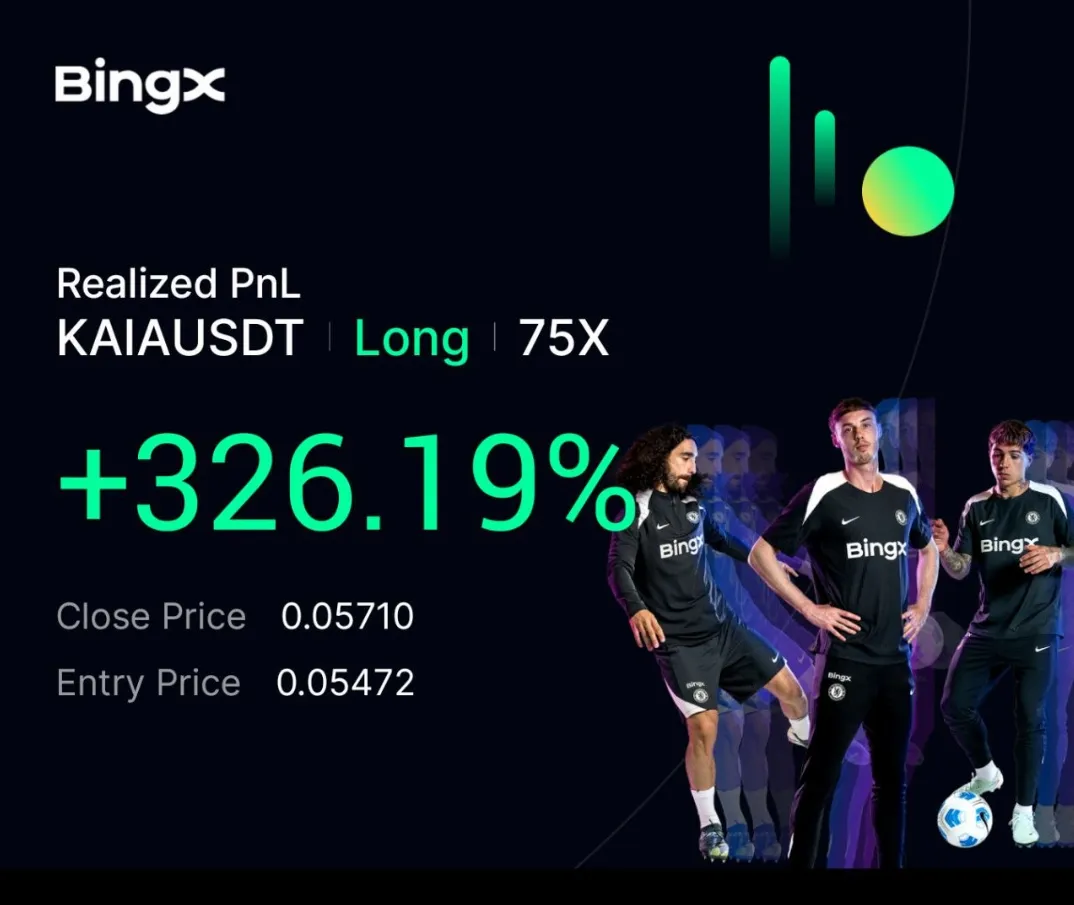
The trade made it possible to capture a move with a result of 326%.
The key signal for entry was the change in price reaction to selling: the seller remained active, but price stopped making new lows. This pointed to the emergence of a limit buyer and the formation of a local deficit.
Additional confirmation came from the aggregated metrics: the efficiency of market buying began to exceed the efficiency of selling, while supply was being absorbed. It was precisely the combination of cluster analysis, volume assessment, and price reaction that made it possible to identify the moment when initiative shifted to the buyer and find a well-grounded long entry point.
From a practical perspective, this breakdown shows that supply and demand analysis, the cluster chart, and Resonance platform tools make it possible to assess not just the presence of volume, but how that volume actually affects price. That is what allows traders to spot deficit in time, recognize a shift in initiative, and make better-grounded trading decisions.
Recommended articles